Chevy Truck Legends
Enhancing the community’s registration, profile submission, and member gallery experience / Responsive Web Design (RWD)
Responsibilities
Information Architecture
Wireframing
Year
2017
Client
General Motors
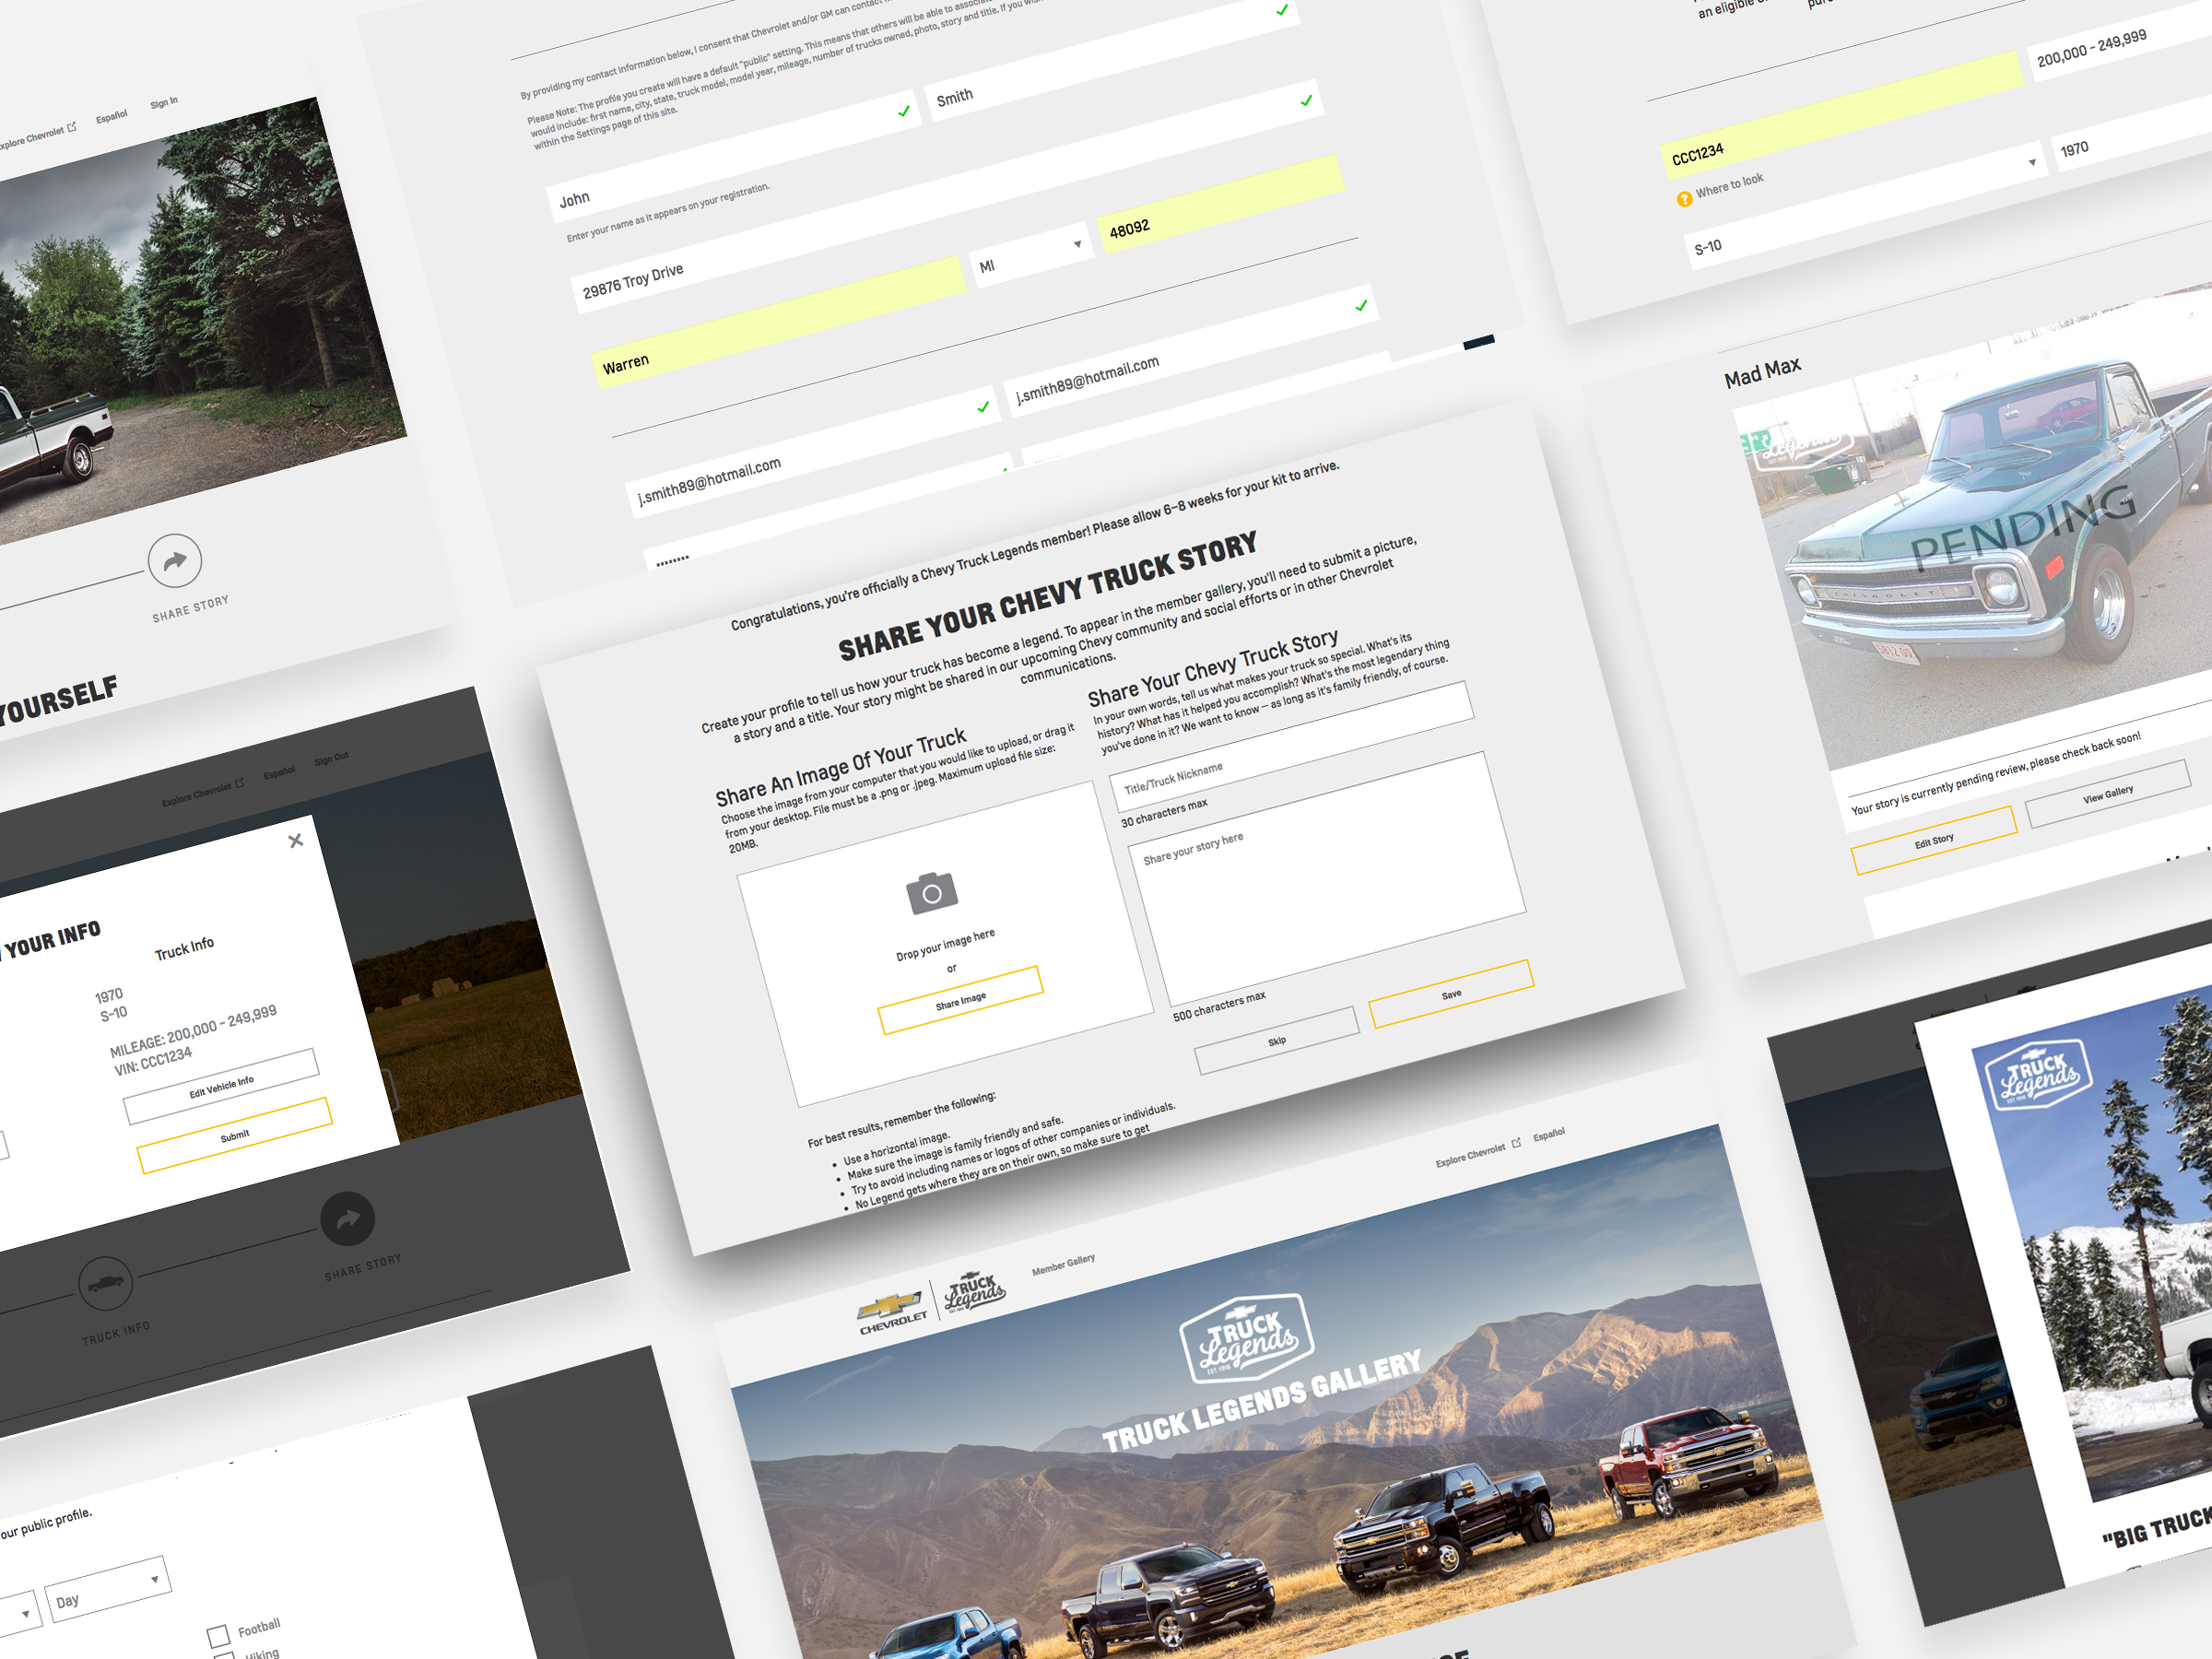
As the UX Architect for this project, one of my primary objectives was to guide users through all three steps of the registration process (Personal Info, Truck Info, Share Story) to ensure they engage with their profiles. Additionally, the member gallery boasts 700 submissions across 40 pages of content, prompting another UX goal: to optimize the member gallery experience for seamless user navigation.
Discovery
Our analytics team discovered that only half of registered users complete their profile submissions. Among those who visit the profile page, merely 20% fulfill all criteria.
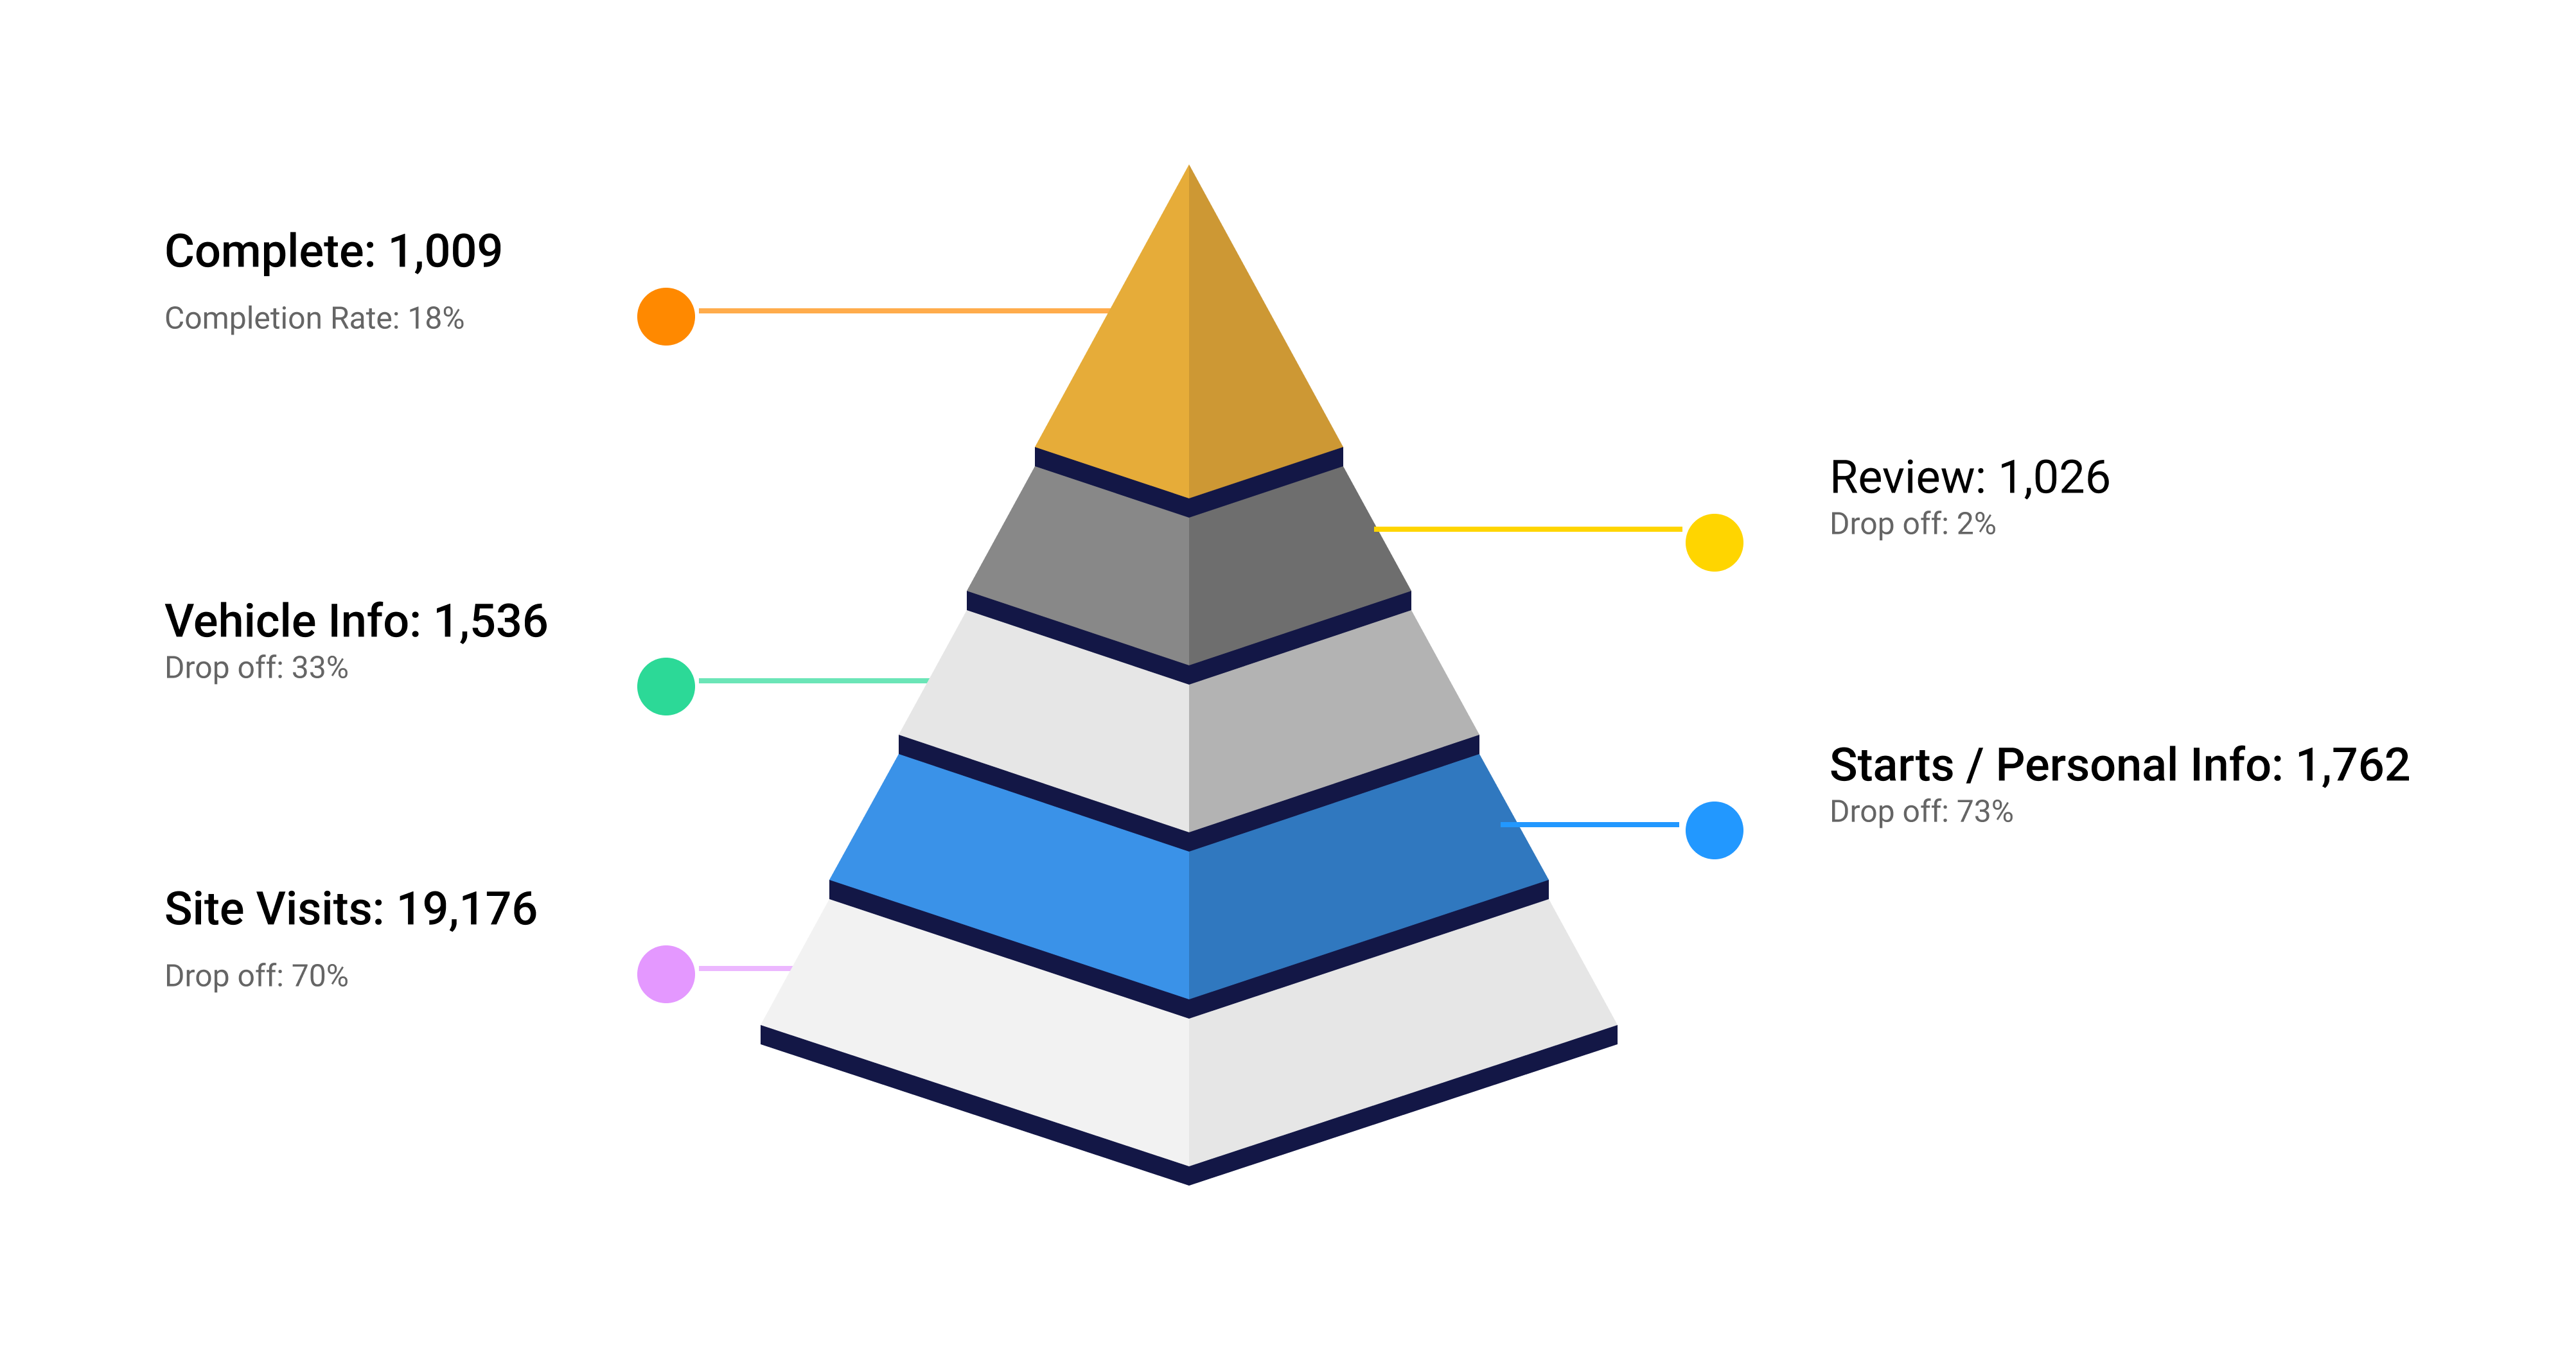
Traffic engagement and drop-off rates within the Truck Legends registration process highlights a significant portion of visits (30%) initiate the registration process, yet there’s a notable drop-off at various stages, particularly between the Personal Information and Vehicle Info steps. Moreover, having a readily available Vehicle Identification Number (VIN) seems to play a crucial role in user drop-off at the Vehicle Information step, contributing to a 33% decline. The drop-off rates are relatively consistent across platforms, with desktop users showing slightly lower drop-off rates than mobile users.
Engagement in the user profile was highest of all sections (home page, member gallery, etc.) with an 83% interaction rate. Engagement in the profile (e.g. Add Story, Add Image, etc.) garnered a 44% interaction rate though click behaviors suggest most users were adjusting one item per visit on average. 33% of the time, they would perform two actions. Adding or editing a story was the most popular thing to do followed by Adding an Image or editing Truck information. Member benefits went over well with consumers as 27% clicked one of the links. Accessories were preferred to Merchandise though both had engagement rates of at least 11% and up to 21%.
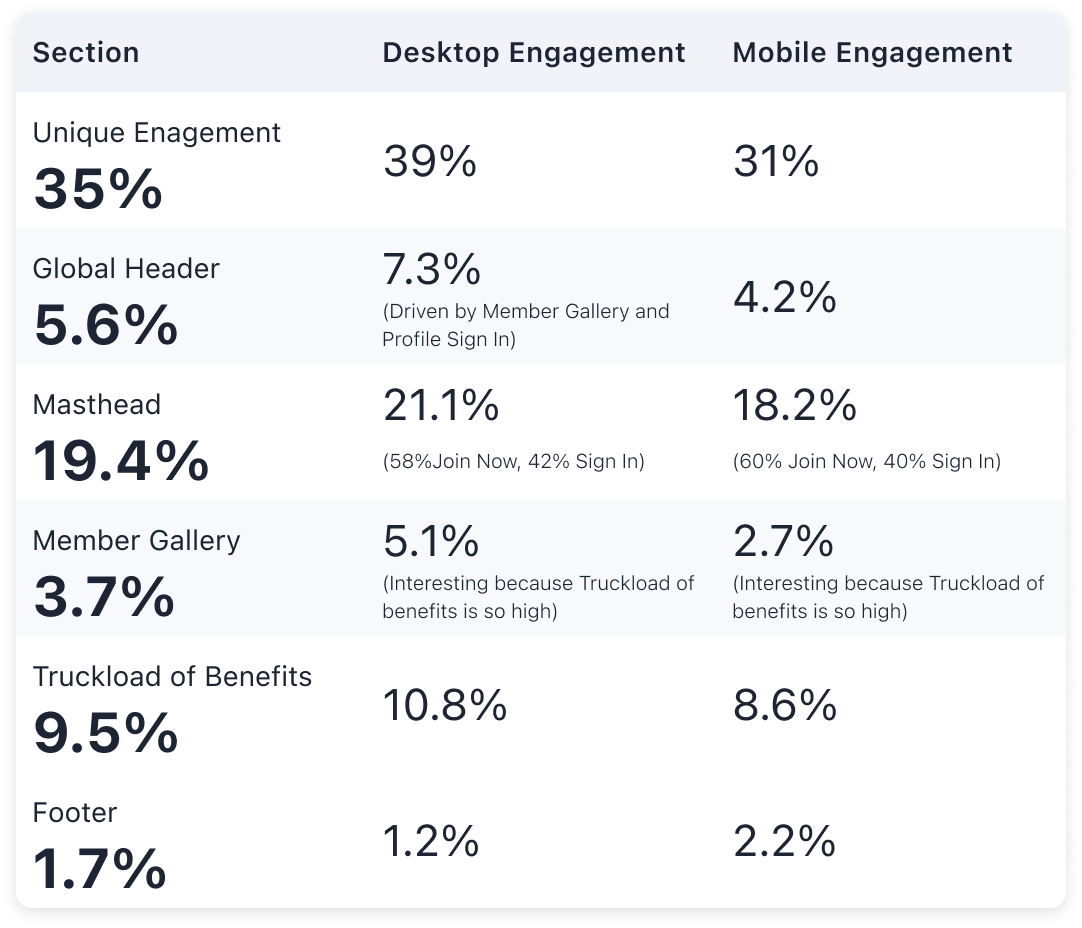
35% of all users who visited the homepage engaged with content. Desktop usage was higher than Mobile though this consistent with Chevy.com. The Masthead garnered the most clicks (19% of all visits) and was roughly a 60/40 split between Join Now and Sign In. Interestingly, the Truck Load of Benefits had an engagement rate of nearly 10% and was much higher than Member Gallery (4%) despite the page placement. Truckload of Benefits messaging appears to be relatively effect based on cited engagement metrics as most clicks were to the registration process. However, the registration completion rate (30%) was not as high as the Masthead (40%) but was better than the overall average (18%).
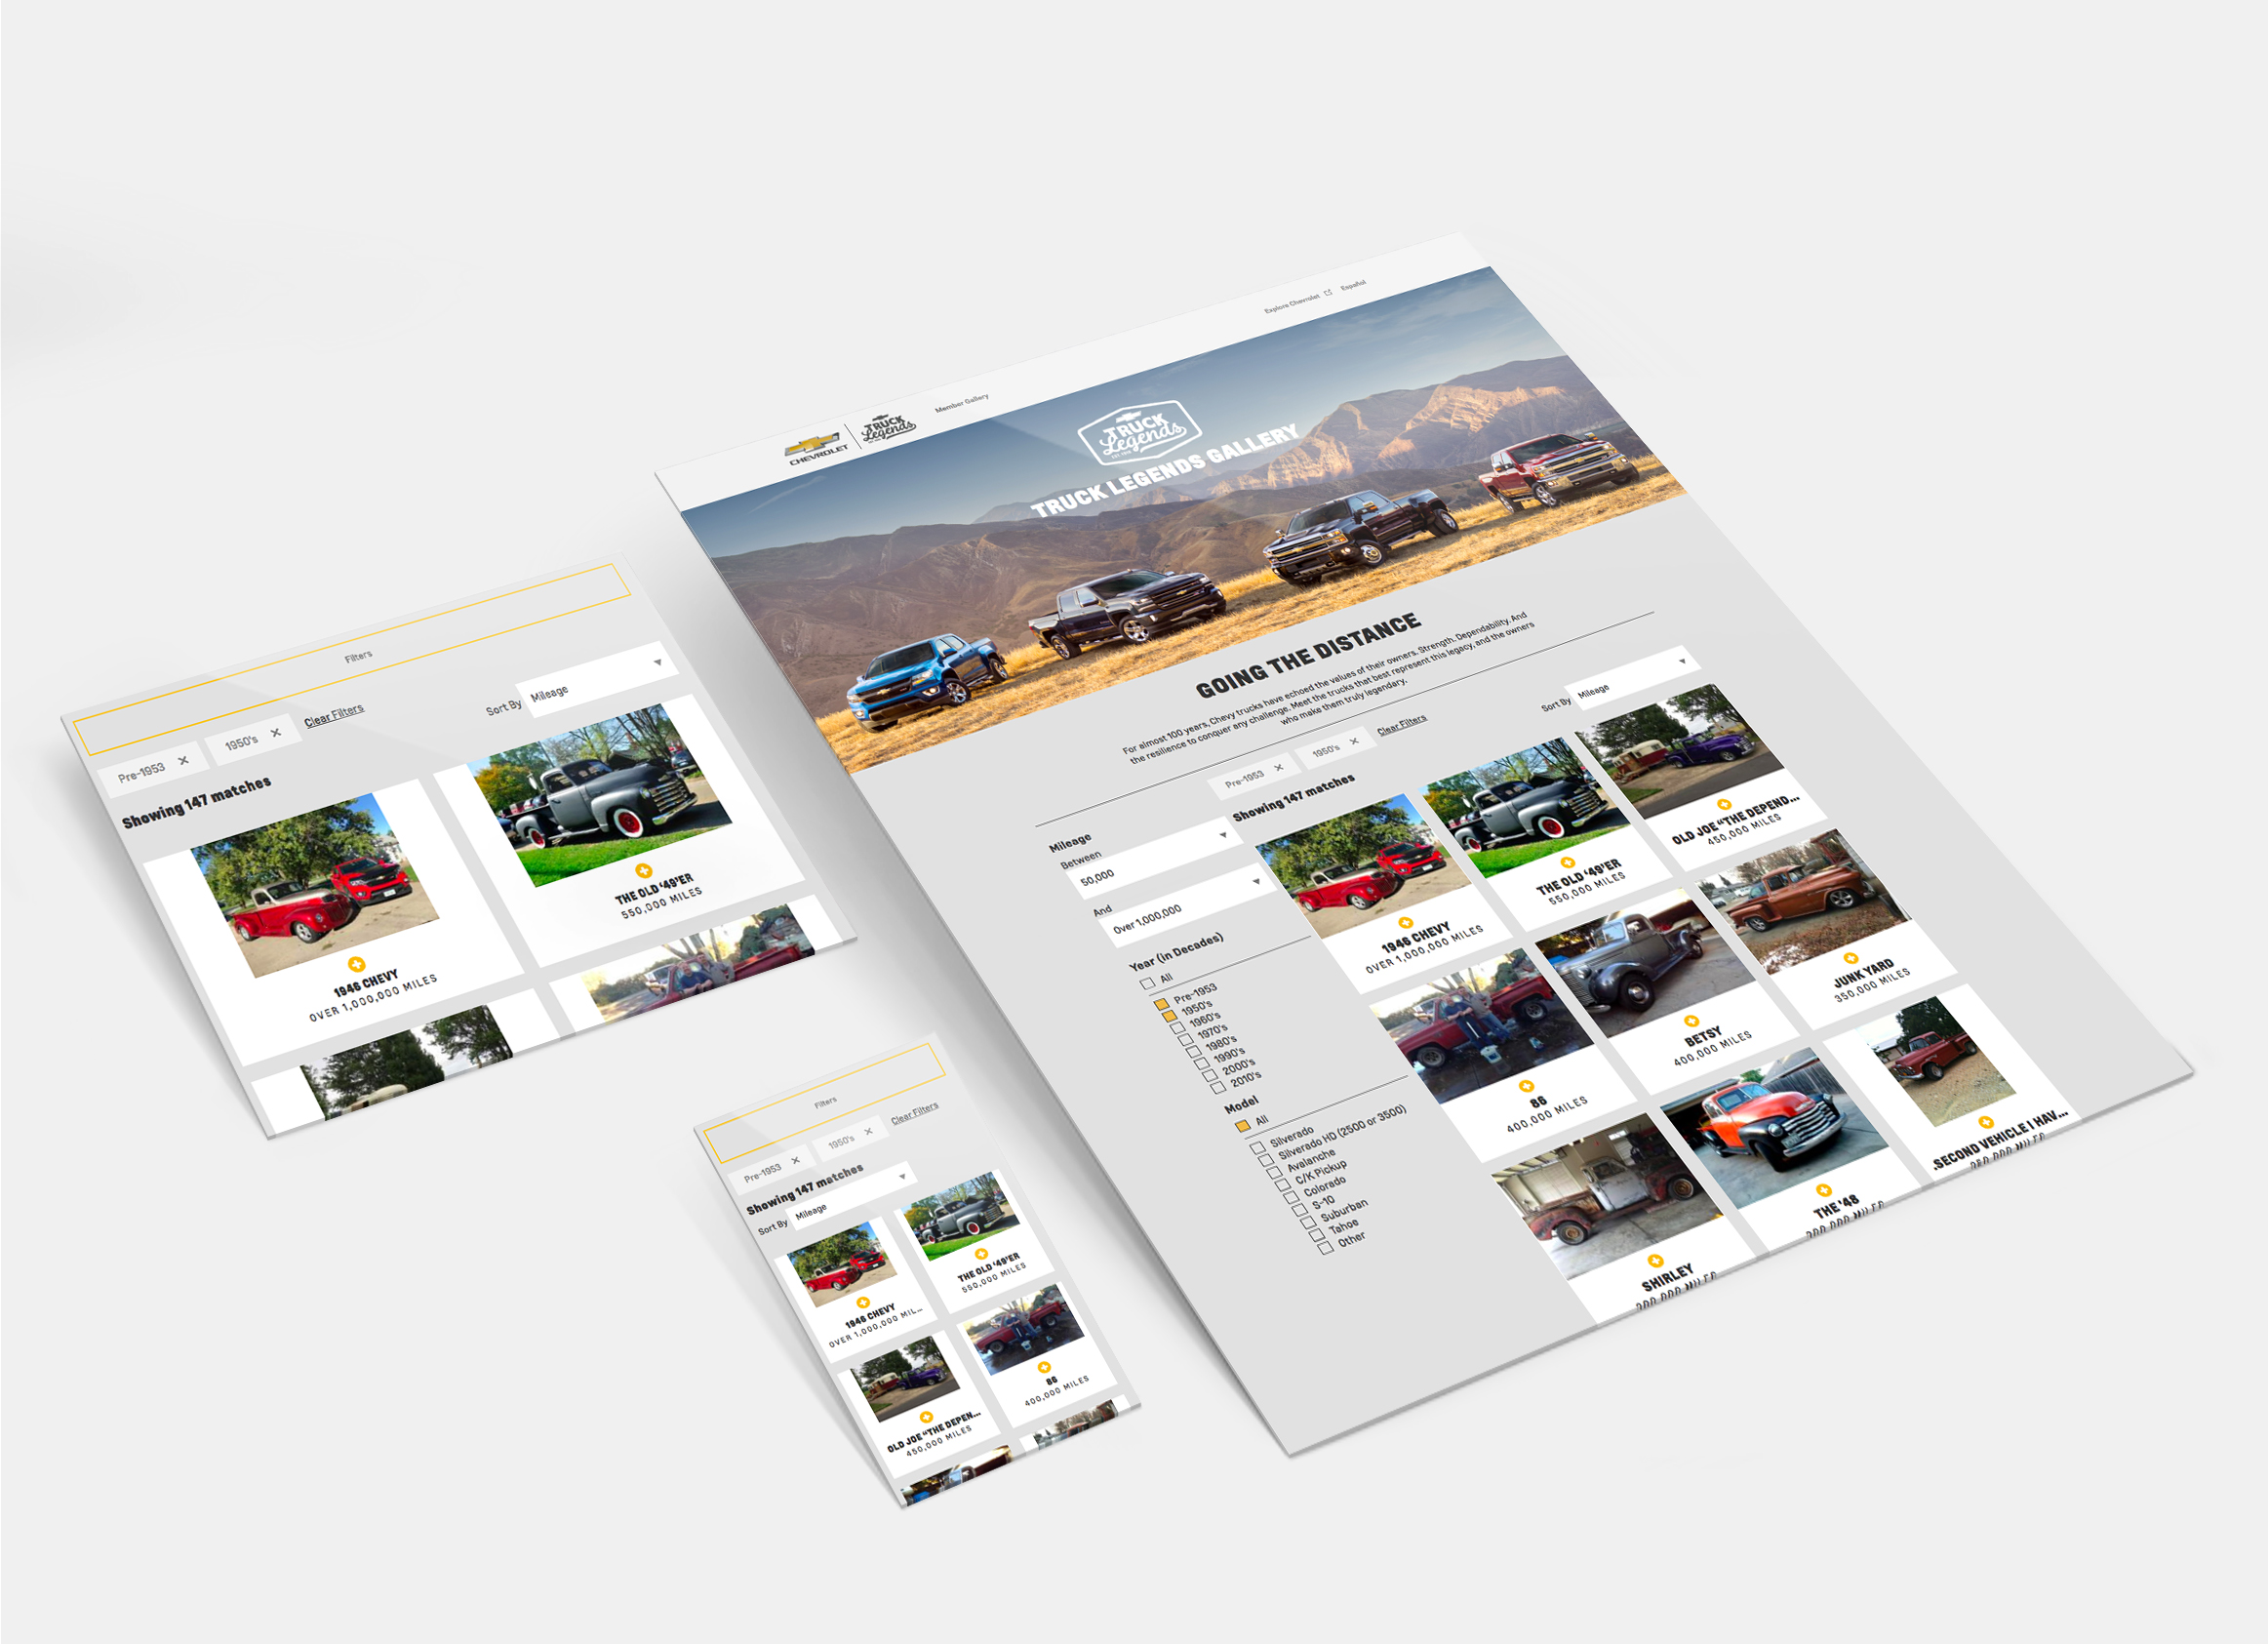
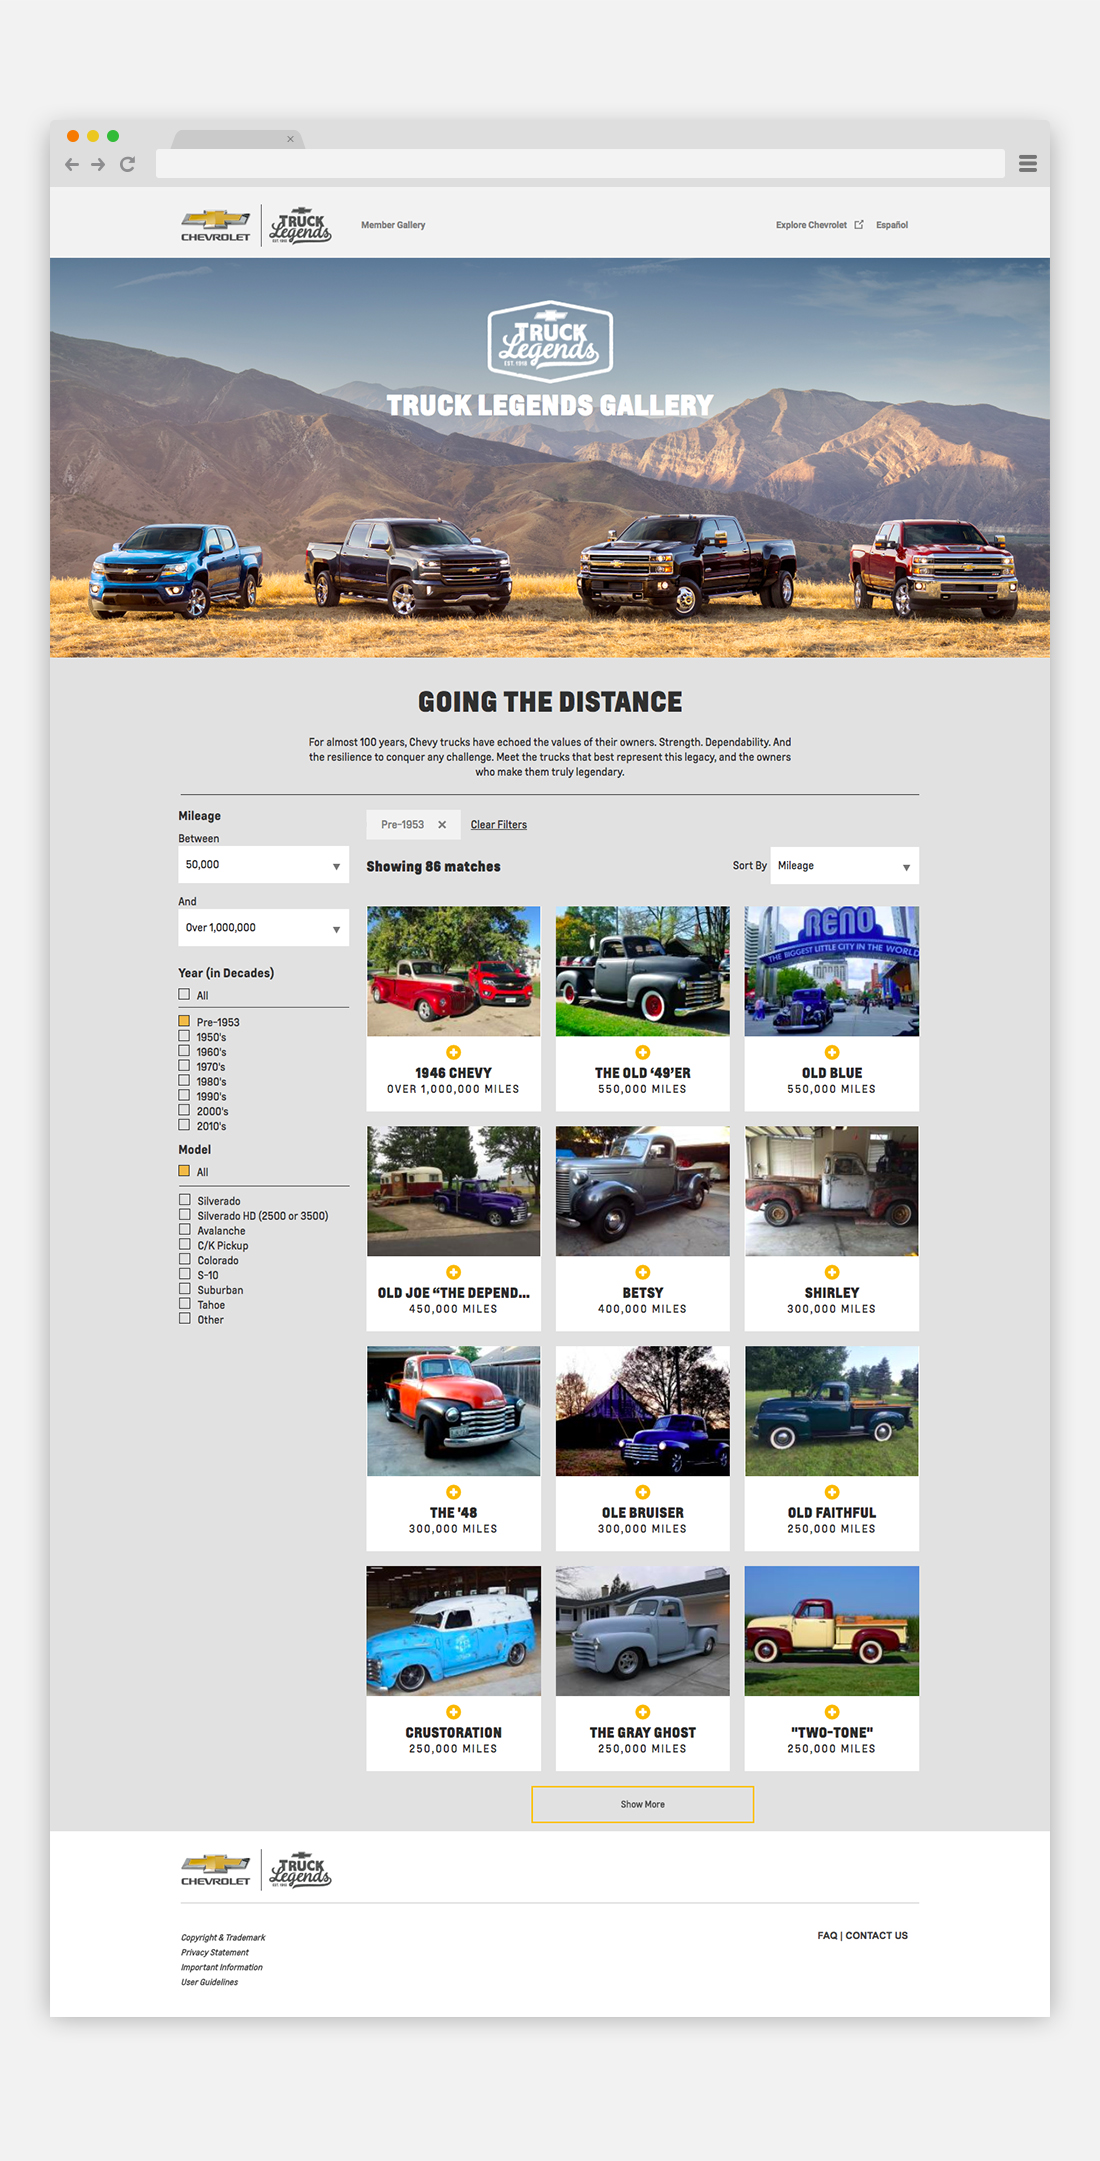
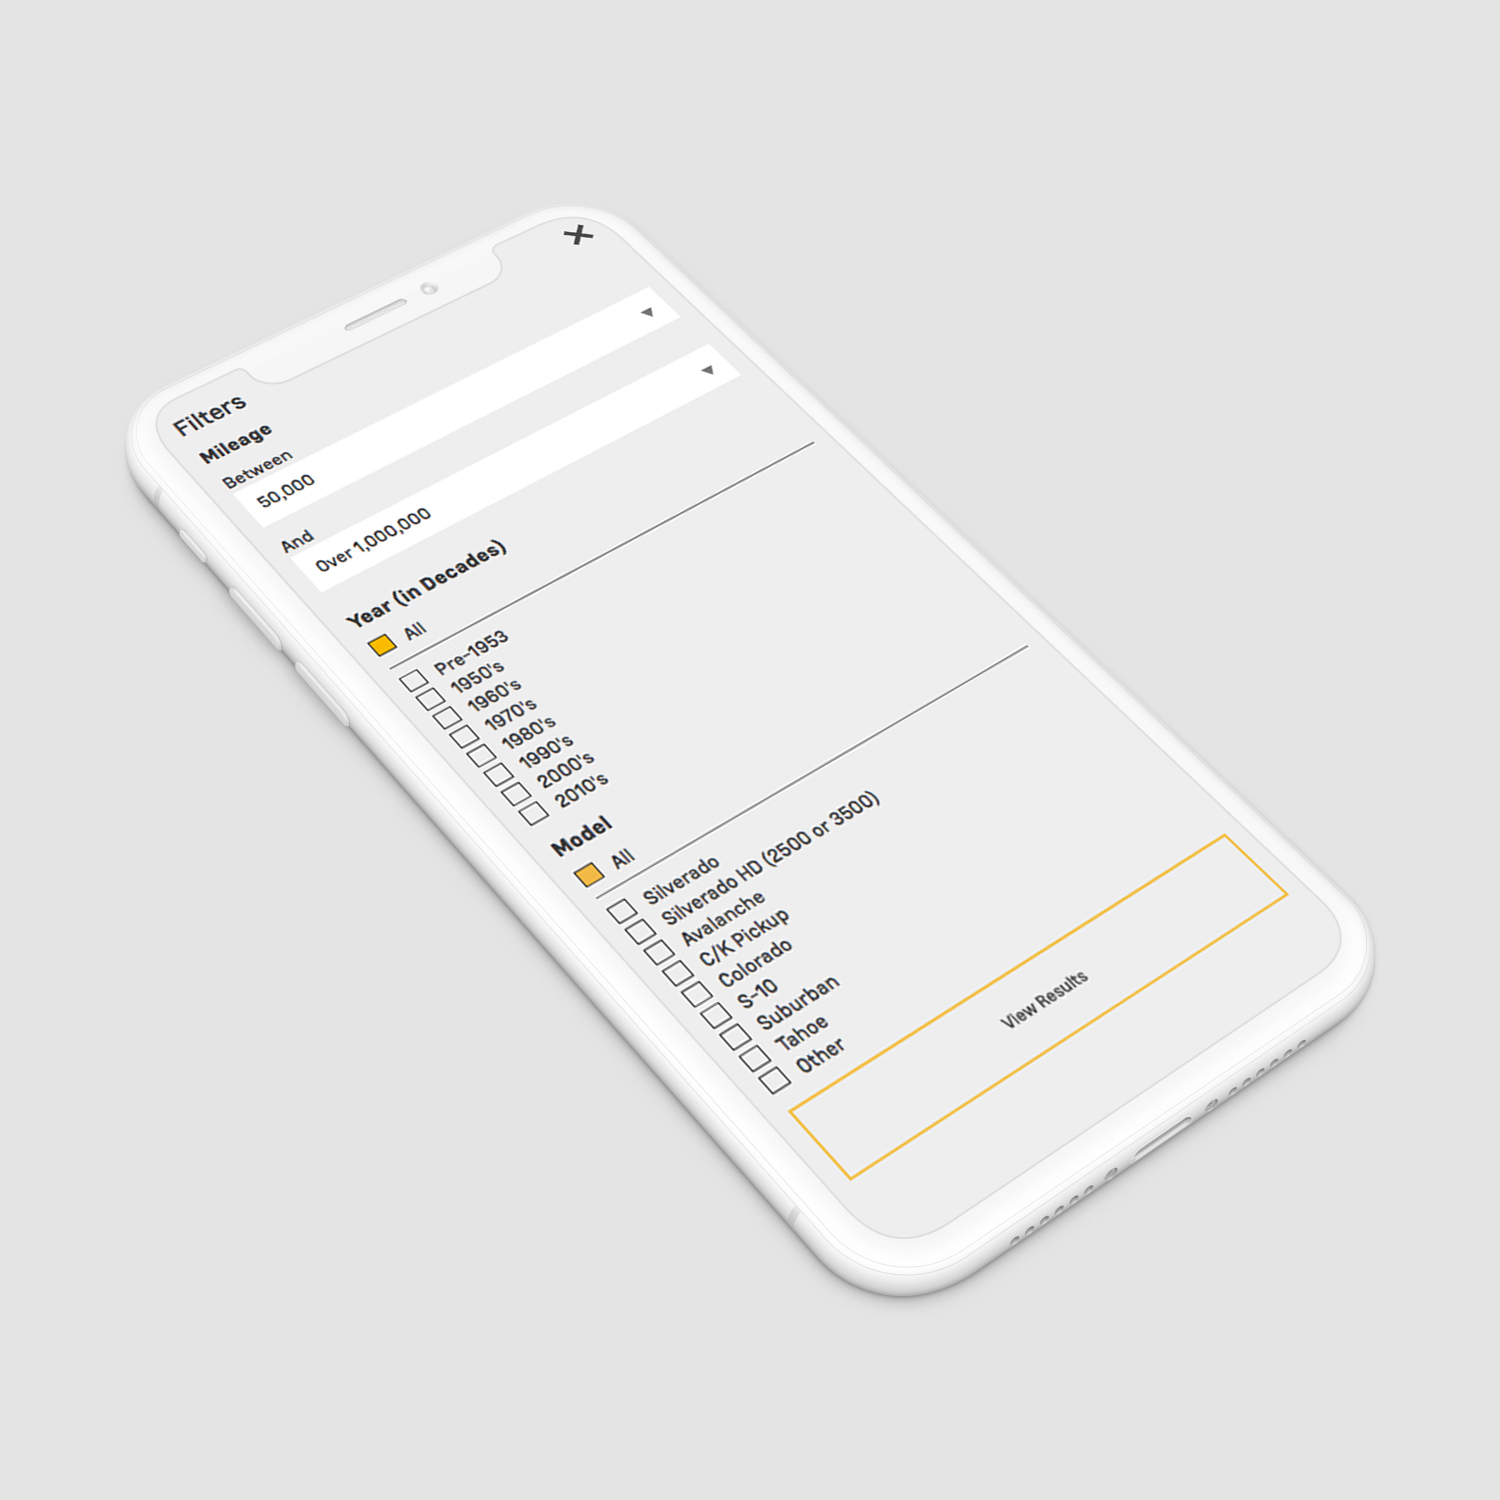
The member gallery page had 700 submissions and 40 pages of content. With this in mind, the other goal for UX was to enhance the experience of the member gallery page so users can easily navigate.
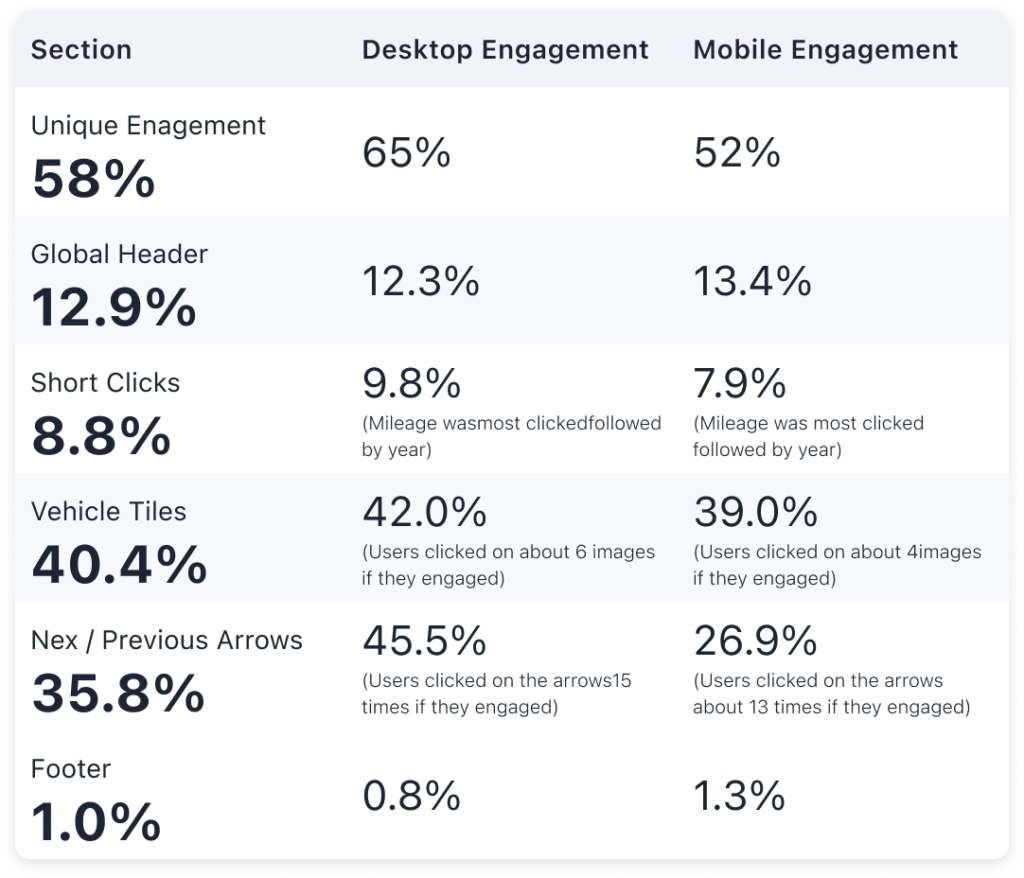
Engagement with Gallery content was very high at 58% Desktop usage was higher than Mobile though this consistent with Chevy.com. In general, users were highly interested in all content such as sorting the images (9%) , clicking into image tiles (40%) , and continuing on the other pages of image tiles (36%). On average, if a user clicked on a image tile then they would click on 5 in total. There is evidence to suggest that users not only clicked on images found on the first page but were likely to get as far as the 14th or 15th page and continued to click into image tiles.
Chevy Truck Legends Community Website
Once 639,000 owners were emailed about the national rollout of the updated chevy truck legends site, on September 28, 2017, site visits were 56,000 in 4 days (13 times the average monthly visits). Registrations were 5,700 in 4 days (more than doubled our registration total). September 29, 2017 marked the highest truck legends visits and registrations since the program launched. Chevy followers also responded very favorably to activity, outperforming Chevy benchmarks across owned channels. @ChevyTrucks Twitter channel saw 3X higher engagements than average. 86% completion rate average for snapchat stories, beating the Chevy Snapchat average (73% – 77%). 61% completion rate average for instagram stories, beating the Chevy Instagram average (42% – 59%).